In 1880, philosopher John Venn invented the Venn diagram as a way to diagram logical propositions and reasoning.
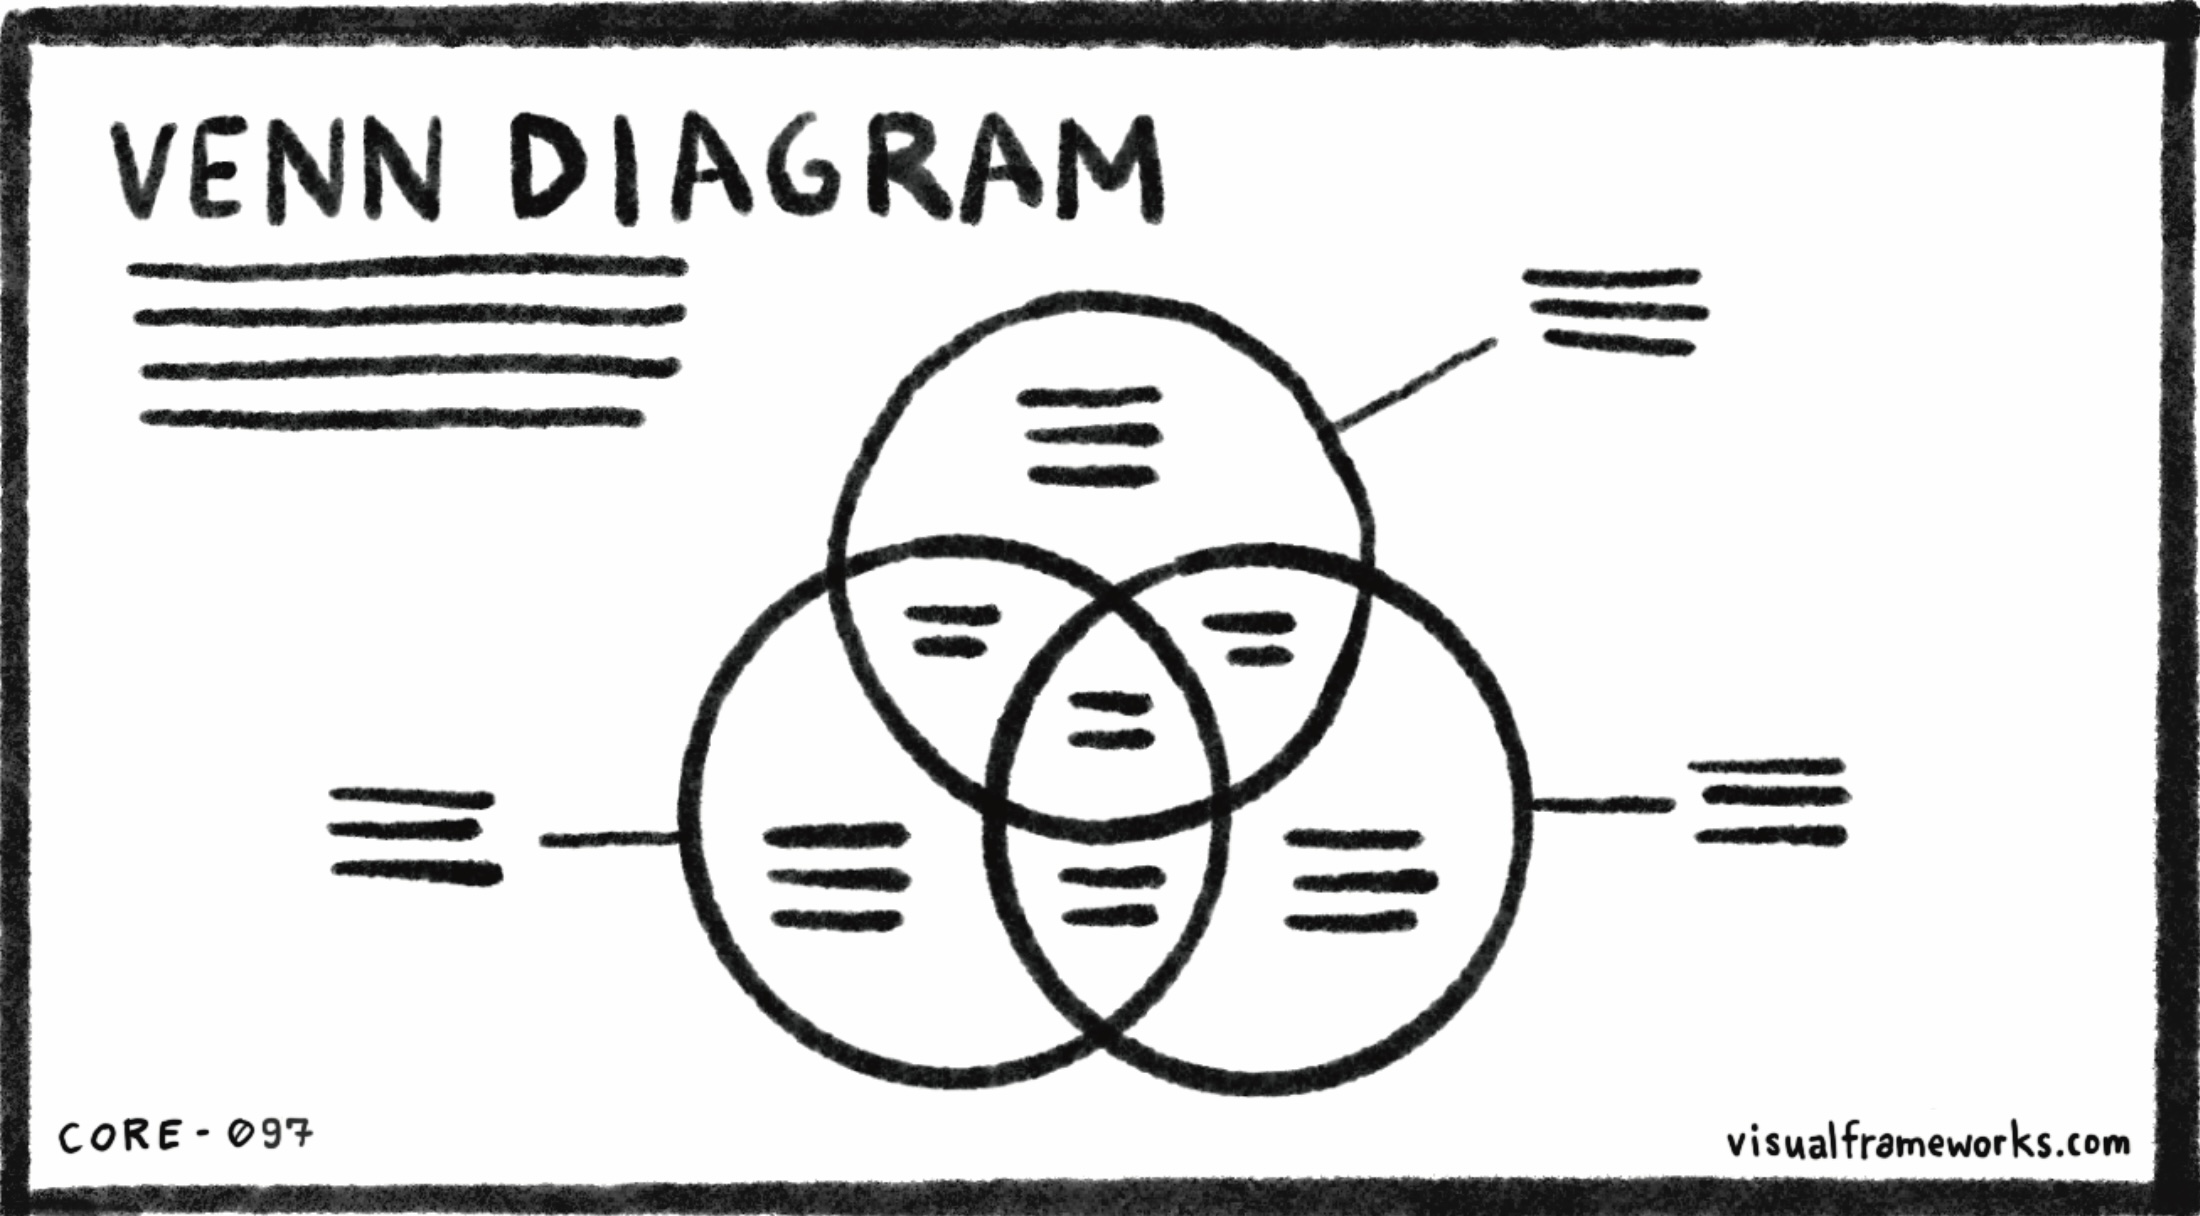
In a Venn diagram, circles or other shapes represent sets of data. The shapes are overlapped with each other in such a way that the areas of overlap contain items the data sets have in common.
Venn diagrams are useful for exploring similarities and differences, and can be used to compare and contrast systems, situations, approaches, and things.
Do you need to compare and contrast two or more things? What do they have in common? How are they different? Can you make a Venn diagram to show the similarities and differences?
See also: Coordinates, 2×2 matrix, Line chart, Bar chart, Grid, Balancing tradeoffs, Puzzle.
CORE-097