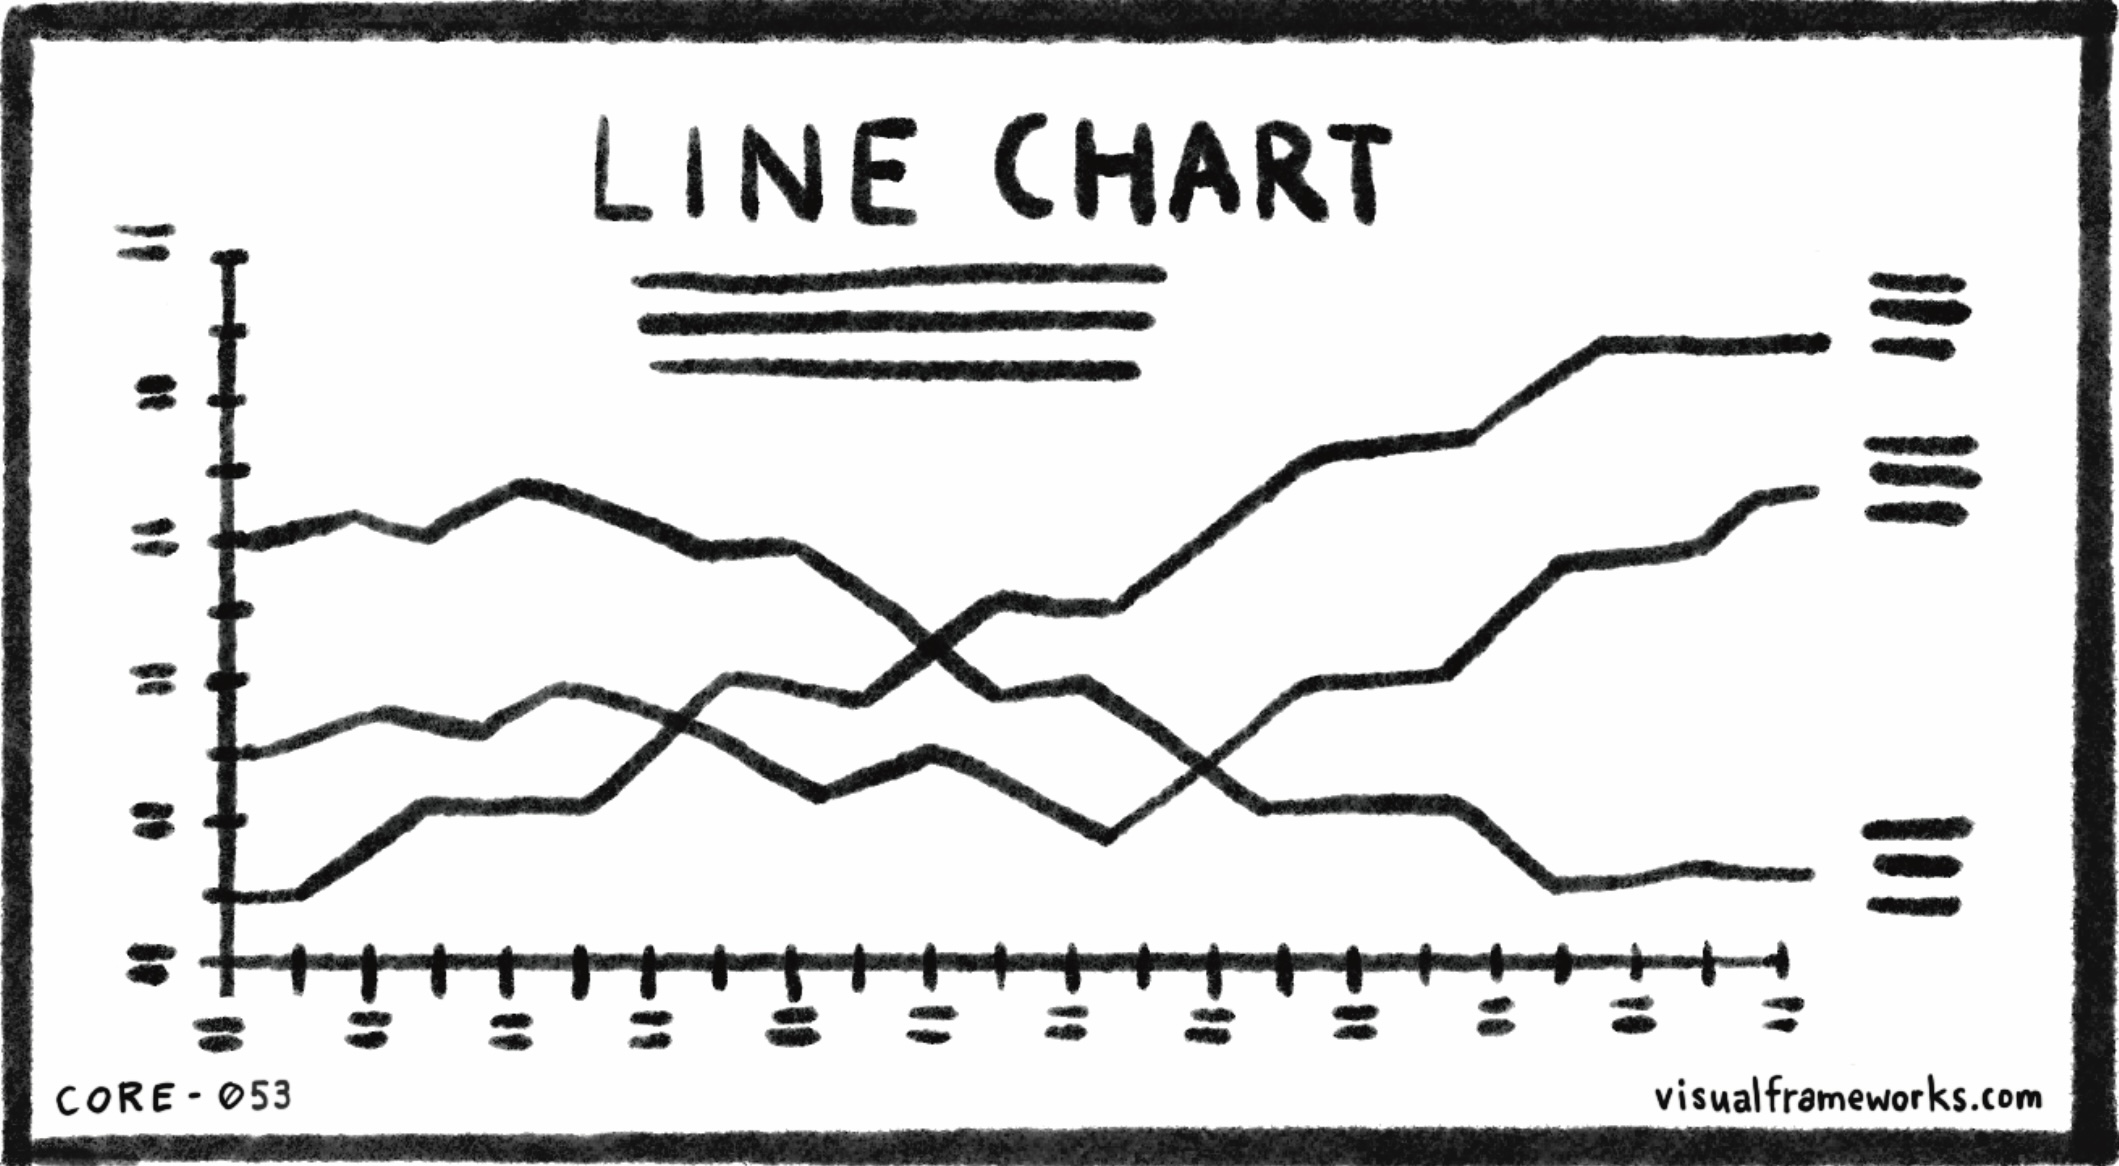
A line chart plots a numerical value against another variable, usually time. Line charts are a great way to track progress. Two maxims can be helpful here:
- Progress, not perfection. It’s easy to punish yourself when you don’t meet your plans and targets. But what’s really important is progress. Whatever you’re measuring, is it better than yesterday? If you’re making consistent progress, that matters a lot more than how fast you’re going. It’s easy to go too fast and burn yourself out, but slow and steady wins the race.
- The trend is your friend. You will never be perfect, and you probably won’t hit your goal every day. Life gets in the way. But a line chart gives you a way to see the longer-term trends. If the line is generally moving up and to the right, you’re on course.
What are the areas you most want to make progress on? Can you make a line chart and track your progress over time?
See also: Coordinates, Bar chart, Timeline, Highs and lows.
CORE-053
