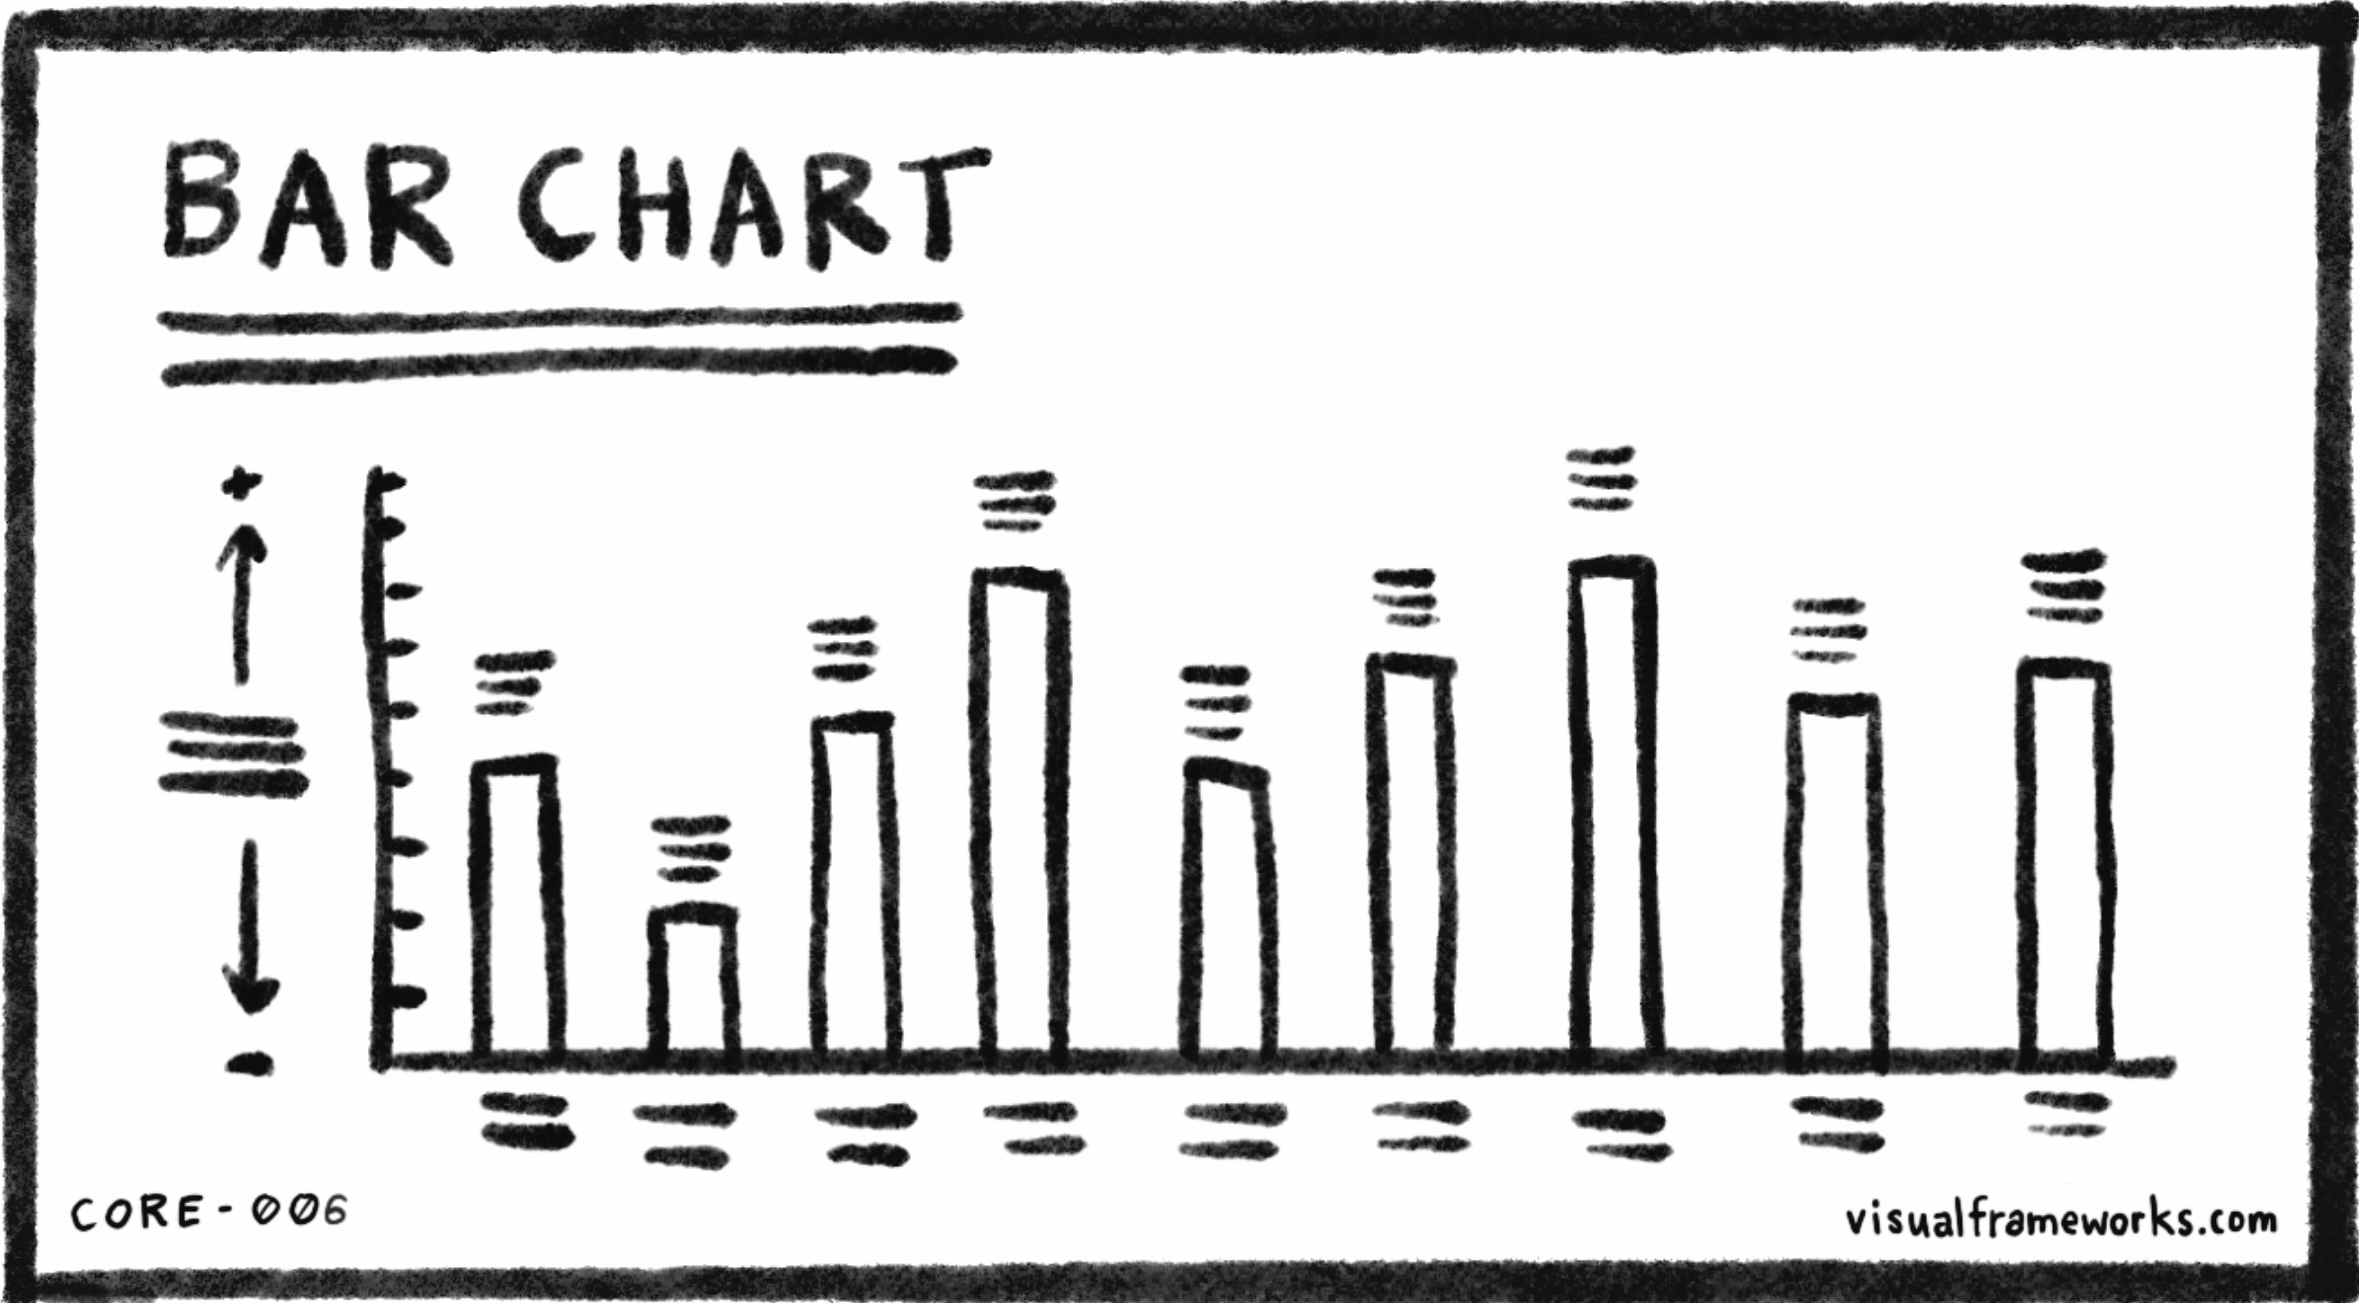
Bar chart: When trying to make a decision, you can determine the value of something by comparing it to other things. When these things are measurable, you can compare them more easily. A bar chart is akin to stacking coins into piles in order to count them. The “stacks” make it easier to compare information across different groups or categories. Bar charts are good for comparing quantities.
How will you decide? What are the most important criteria? What do you need to quantify or measure? Compared to what?
See also: Coordinates, Line chart, Grid.
CORE-006
